8th International Nannoplankton Association Conference
ABSTRACTS
[Abstracts] [A] [B] [C] [D] [E] [F] [G] [H] [I] [J] [K] [L] [M] [N] [O] [P] [Q] [R] [S] [T] [U] [V] [W] [X] [Y] [Z]
Eric de Kaenel:
Late Miocene calcareous nannofossil high-resolution biostratigraphy from the Ain El Beida section (Morocco): correlation to the astronomical curves and relation to climatic changes
(Poster)
The Ain El Beida section is located a few kilometres SE of Rabat on the Atlantic coast of NE Morocco. Palaeogeographically, the section is at the western end (Atlantic entrance) of the Rifian Corridor, one of the two principal passages into the Mediterranean before the Messinian Salinity Crisis. This section, of 77m, contains a complete set of overlapping marl layers that vary in thickness from 50 to 270cm. The marl succession is called the 'Marne Bleue' and is characterised by cycles composed of reddish and blue layers.
The Ain El Beida section was investigated for magnetostratigraphy and isotope stratigraphy (oxygen and carbon isotopes) by Frederick Hilgen and Wout Krijgman of the Faculty of Earth Sciences at the University of Utrecht. Foraminifera were studied by Sandra Gaboardi of the Department of Earth Sciences at the University of Parma. The purpose of this team research was to investigate a marine section that represents most of the 'Messinian Gap' interval just outside the Mediterranean. This section will serve to link the classic regions in the Mediterranean with the World Ocean. The stratigraphy of the Upper Miocene from the Ain El Beida was established through integrated magnetostratigraphy, biostratigraphy and isotope stratigraphy. The primary aim of the calcareous nannofossil study was to establish a biostratigraphic framework and to identify and precisely date, astronomically, the nannofossil events. Secondly, a quantitative analysis was performed to reveal species associated with climatic changes in order to construct a Sea Surface Temperature (SST) curve based on calcareous nannofossils.
The Messinian Stage extends from 7.242Ma (i-cycle 690 = Tortonian/Messinian boundary) to 5.330Ma (i-cycle 510 = Messinian/Zanclean boundary) and represents 1.912my. The 'Messinian Gap' that corresponds to the evaporite events in the Mediterranean (Salinity Crisis) extends from 5.958Ma (i-cycle 568) to 5.330Ma (i-cycle 510). This time-interval corresponds to 0.628my. The i-cycles refer to the number of the corresponding peaks as introduced for the Plio-Pleistocene by Lourens et al. (1996). A total insolation cycle (two i-cycles) has an average duration of 20 700kyr and is represented by an insolation maximum (odd coding) and by an insolation minimum (even coding, indicated on Figure 1). The Ain El Beida section includes 101 insolation peaks (i-cycles) from i-cycle 520 (at 5.445Ma) to i-cycle 620 (at 6.467Ma) and represents a duration of 1.022my. The missing top cycles (i-cycle 521 to i-cycle 510), to complete the 'Messinian Gap' interval, have been investigated at a nearby section (work still in progress).
Corresponding to the beginning of the Salinity Crisis in the Mediterranean (base of the Calcare di Base Unit), i-cycle 568 can be placed either at: the last occurrence (LO) of Amaurolithus amplificus (i-cycle 573); at the last common occurrence of Cryptococcolithus mediaperforatus (forms larger than 5µm) (i-cycle 570); or at the LO of Discoaster neorectus (forms larger than 20µm) (top i-cycle 569). Other bioevents have been astronomically dated at the Ain El Beida section (Figure 1), including the top of Discoaster calcaris, the top of common Reticulofenestra rotaria, the top of Helicosphaera stalis and the top of Discoaster quinqueramus. All bioevents indicated on Figure 1 appear useful for the biostratigraphic resolution of a period that has often been called "a quiet zone".
The method used to construct the SST curve is identical to that for the foraminifer SST curve. The SST record is based on selection of temperature-sensitive species and is obtained by calculating the ratio of warm-water indicators versus the total sum of warm- and cool-water indicators. Of a total of 207 species recorded in this section (from 297 samples), 94 have been counted (abundance count in number of specimens per unit area of the slide) to determine their fluctuations with insolation maxima (reddish layers) and minima (blue layers). The selection of temperature-sensitive species has been obtained by performing two types of statistical analyses (principal component and a t-Test analysis).
The calcareous nannofossil curve obtained by this method is compared to the oxygen isotope curves (delta18O record of Globigerinoides obliquus) and to the planktonic foraminifera curves (Globigerinoides total and foraminifera SST). The resulting nannofossil curve expresses the same fluctuations as those defined with oxygen isotopes and foraminifer curves. These comparisons clearly indicate that the nannofossil curve also represents sea-surface temperature fluctuations and therefore is referred to as a calcareous nannofossil SST curve.
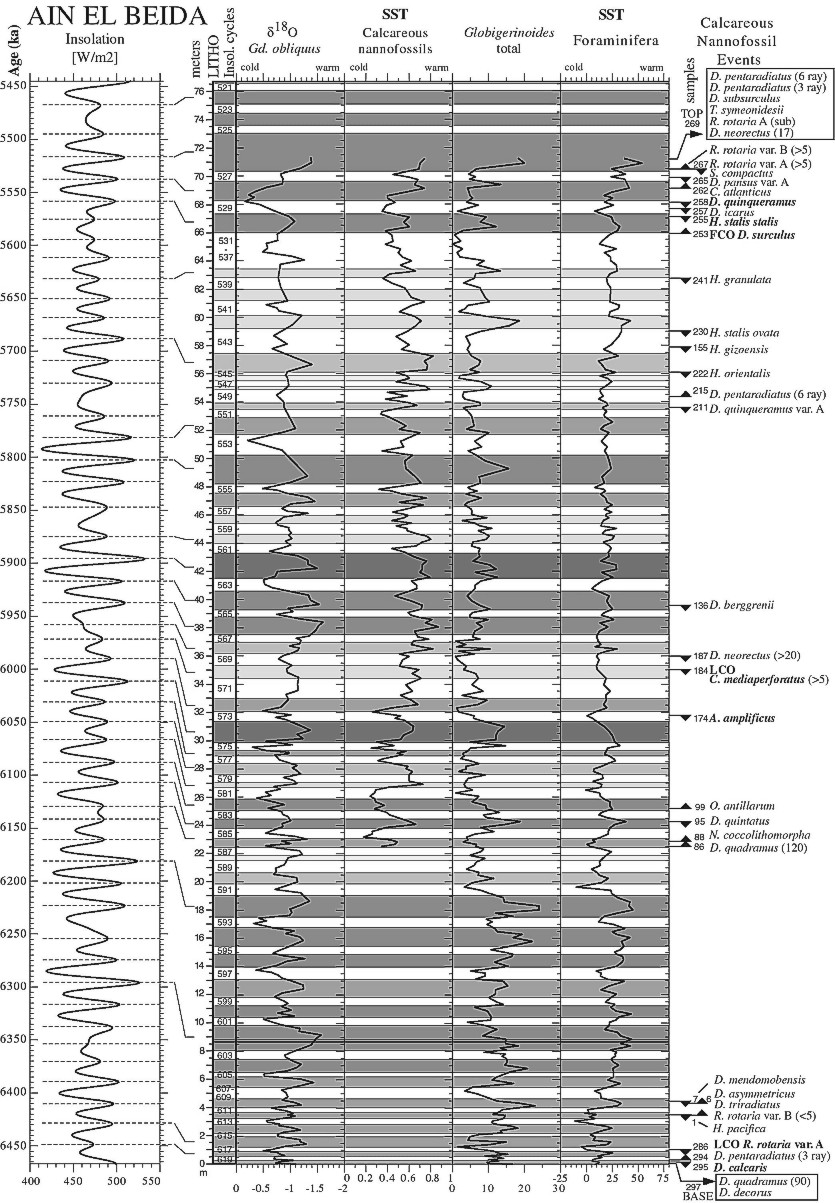 |
| Figure 1: Correlation between the insolation curve of Laskar et al. (1993) and the lithologic sequence of the Ain El Beida section (Morocco). Insolation cycle (i-cycle) refers to the number of the corresponding insolation peak introduced by Lourens et al. (1996). The ?18O record is based on Globigerinoides obliquus. The calcareous nannofossil SST (Sea Surface Temperature) curve is based on the ratio of warm- versus cool- and warm-water species. Major biostratigraphic events observed in this study are indicated. |
References
Laskar, J., Joutel, F. & Boudin, F. 1993. Orbital, precessional, and insolation quantities for the Earth from -20Myr to +10Myr. Astron. Astrophys., 270: 522--533.
Lourens, L.J., Antonarakou, A., Hilgen, F.J., Van Hoof, A.A.M., Vergnaud-Grazzini, C. & Zachariasse, W.J. 1996. Evaluation of the Plio-Pleistocene astronomical timescale. Paleoceanography, 11(4): 391--413.
[INA8]
[Registration and Accomodation
Form]
[First Circular and Pre-Registration]
[Second Circular]
[Division of Micropalaeontology] [Department of Geosciences] [Bremen University]
Copyright © 2000, most recent revision July 24, 2000
Tania Hildebrand-Habel (hiha@micropal.uni-bremen.de)